What is Ransomware?

Ransomware is a type of malicious software, or malware, that prevents you from accessing your...


What are infographics? Why are they important for a company’s marketing purposes? Infographics are a collection of imagery, charts, and minimal text that give an easy-to-understand overview of a topic. In the past decade, they’ve become a staple of communication in classrooms, the workplace, and across the internet. Visuals tell a story faster than words. Infographics are great at communicating information quickly and excel at breaking down complex content that might be hard for someone to understand by reading only. Oftentimes, large amounts of numbers, statistics in a spreadsheet, or even large chunks of text can be daunting to the reader. Infographics are used a powerful tool that allow the viewer to easily digest information using visual data, charts, and statistics.
Infographics have been around since hieroglyphic times, but have been popularized by being used in journalism. I mean, without infographics we wouldn’t have maps! I know for a fact I wouldn’t survive without my Google maps on my phone. They are used in almost every field. We see them everywhere every day; they are an integral part of our communication.
Infographics can be incredibly useful for any business. Companies are fighting to connect with their audience and a well-placed infographic can achieve a lot. 90% of the information transmitted to the brain is visual, only 20% of text is remembered, and infographics are 30 times more likely to be read than just text alone. They are also extremely shareable, making them a great tool for content marketing, especially in social media marketing. 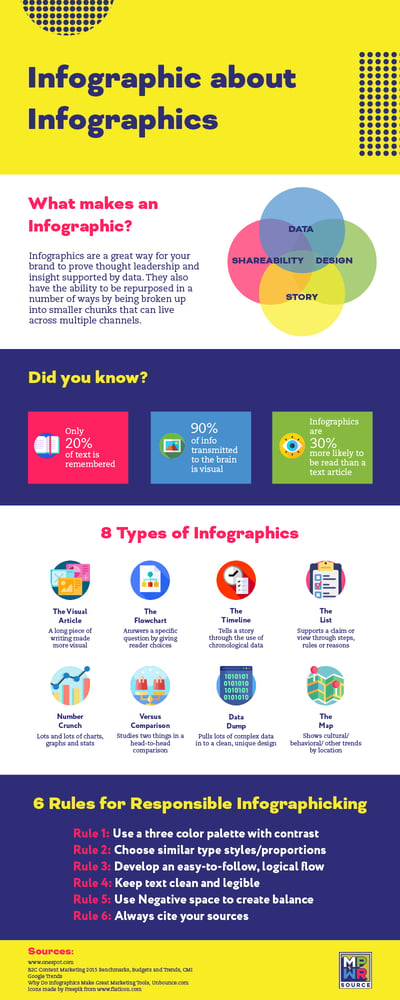
 Infographics are a dynamic tool, but they still need to follow the basic rules of design. As always, they should avoid layout sins, and use the elements of design to help make a visually pleasing design. I would start with a sketch or an outline of the general idea for the infographic. Elements you can include are photos, illustrations, graphics, and even motion and video. Companies should follow any necessary style guides to ensure brand consistency. Good use of color of typography are pertinent to a well-designed infographic. Related items should be group together and white should be used to avoid any confusion. A grid can help align everything and ensure proper hierarchy. Ensure balance and try to avoid walls of text. Visual elements take the place of large chunks of words. Research should be done on what could be used to best visually show the content. A bar graph, a pie chart, a timeline, or something else? Also, make sure to cite all of your sources on your layout. The end goal is an infographic that educates and attracts a viewer.
Infographics have been gaining steam over the years and the popularity of social media has increased the use of them. Brands should take note of how others use them and try to see if they would incorporate into their strategy. Content is king and it’s no wonder with good material and a pleasing design, brands can connect with their audience in a way that they may not have seen before.
Finally, it doesn’t matter how pretty your infographic is if the content isn’t compelling. Companies need to make sure that the content is worthy of sharing and creating an infographic to begin with. Businesses first need to make sure that their content marketing strategy is solid.
Ransomware is a type of malicious software, or malware, that prevents you from accessing your...

Businesses and home users alike are under threat from increasingly aggressive andbrutal ransomware...